| Section | |||||||||||||||||||
|---|---|---|---|---|---|---|---|---|---|---|---|---|---|---|---|---|---|---|---|
|
Groovy script tester availability
The Groovy script tester in JMCF is available on the Custom field configuration screen when you write a Groovy script to return a:
- Value expected by the calculated custom field in the Groovy Formula field
- Format for the calculated custom field in the Format Expression field
Using the Groovy Script tester
After writing your Groovy script in the editor, click on the Test Groovy Script button on the toolbar. A modal dialog window opens, asking you to pick an issue to run the Groovy script against, as well as a linked issue, where applicable.
Selecting an issue
You can select the issue from one of the following options:
- Issue key: start typing an issue key, you will be offered options based on your issue browsing history
- [Select issue]: if you click on
[Select Issue], an Issue selector window gets displayed. You can select the issue either from:- Recent Issues: Displays issues that you have recently viewed and first 50 issues from your current search or
- From Filter: Displays issues of your saved searches.
The issue variable used in your script will point to the above-selected issue.
Testing your Groovy script
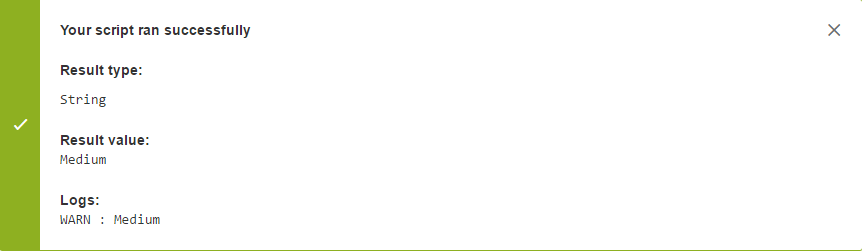
After selecting issue against which the script should be tested (as explained above), click on Test. The following information will be displayed. This information can be used for debugging.
Message: Success/error message based on the test result.
- Result type: Data type of the result.
- Result value: Value of the result.
- Stack: If an exception was thrown during the execution of the script, a stack trace will be displayed.
- Logs: Information logged using the
logvariable.
Example
| Panel | |||||||
|---|---|---|---|---|---|---|---|
Test a script that fetches the username of the user the issue is assigned to:
|
Debugging your script
If you encounter an error during testing, you will need to debug your script. The Message, Stack and Log information displayed in the script tester result panel aids in debugging the script.
Using the Message and Stack trace
In the above example, after testing the script against an issue that is unassigned:
- Identify the problem, from the
Messagethat displayed a null pointer exception error and theStackthat displayed the line number on which the error occurred. Correct the problem, using the safe navigation operator ? that avoids the null pointer exception.
Code Block return (issue.get("assignee")?.getName())- Retest the script, as explained above and verify the result in the script test panel. The result value will be null

Using the log variable
Using the log variable, you can debug your script, a step further, by adding information into the log. For example, while testing a condition, if the result evaluates to false when you expect it to be true, you might want to know what values are being compared in your condition. In such cases, you can use the log variable to display the value.
| Note |
|---|
The log calls should always be used before the return statement because they would never get executed after it. |
Consider the following script,
| Code Block |
|---|
return (issue.get("assignee")? == "Scharlie") |
- Test the script, against an issue assigned to a user
Scharlie.The script test would evaluate tofalse.
Identify the problem, using the log variable (as shown below) and check what values are being compared.
Code Block log.warn("Fetched user is" + " " + issue?.get("assignee")) return (issue?.get("assignee") == "Scharlie")Retest the script, as explained above and verify the result in the script test panel.
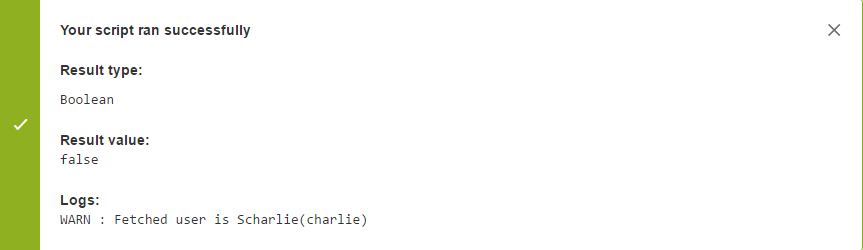
The script is comparing a user object to a String value.
Correct the problem, by fetching the username and then comparing the values
Code Block log.warn("Fetched user is" + " " + issue?.get("assignee")) return (issue?.get("assignee").getName() == "Scharlie")
- Retest the script, as explained above and verify the result in the script test panel. Now the condition evaluates to true.

- Remove your logging code, so that log entries don't get written to Jira's logfile each time the post-function is executed.