Our new Appfire Documentation Space is now live!
Take a look here! If you have any questions please email support@appfire.com
JMWE logs
- Radhika Vijji. (Unlicensed)
- David Fischer
- Richard Stone[Appfire] (Deactivated)
Logging level
By default, events with a level below INFO are not stored and therefore cannot be included in the logs downloaded or viewed in the table below. However, for troubleshooting purposes, it is possible to temporarily increase the amount of logging by changing the minimum level. The new level set here will remain for one hour, and will thereafter revert to the default level, i.e. the INFO level.
To set a temporary log level:
- Select the required level from the
Temporary log leveldrop-down - Click on
Apply.
Click on Reset to revert the log level to the default INFO level.
Send errors and/or warnings to a Webhook
You can also monitor your JMWE errors and warnings related to post-functions and actions on your own applications by configuring a webhook.
To configure a webhook:
- Enter the Webhook URL where you want your errors and/or warnings to be sent.
- Select whether you want Errors and Warnings or Only Errors sent.
- Click Apply.
When an error is thrown, the webhook will post the error data in real time.
See the example below to understand how to interpret the raw content.
Log viewer
By default, the Last day logs with a level higher than INFO are displayed in the table. You can filter the logs based on when they were created - When and the Log level - Level. To filter them further, click on More filters to add the below additional filters:
Filters
You can filter log events based on the;
- message type Eg: security-error, template-error, workflow-warning etc - Message type
- post-function executed - Post-function
- name of workflow - Workflow name
- name of the transition - Transition name
- Issue key on which the transition was triggered - Issue key
- username of the user who triggered the transition - Username
- execution ID that can be copied from Context (explained below) - Execution ID
Click on Apply filters to filter the logs
Entries
Only the 200 most recent events that match your filters are displayed in the table. Each entry has the Timestamp, Level, Post-function, Message Type and Message. In most of the cases, the failure details are displayed in the Message. And if that isn't sufficient enough to debug your problem you need to click on > of a log entry to see the following information:
- Error details, displays the error details, if any
- Error code
- Error message
- Field error(s): Errors related to fields
- Context, displays the context of the log entry
- Username: username of the user who triggered the transition Eg: djohn
- During: which process the entry was created. Eg: post-function-execution
- Execution ID: The ID of a specific execution of a post-function. This allows you to search for all events generated by a single execution of a post-function.. You can add this to the filters by clicking on
add to filterslink. - Issue key: issue key of the issue on which the transition was triggered
- Jira REST API call, displays information on the call made to Jira
- Method: Method used. Eg: PUT,get
- Url: REST Url
- Data: Object or value sent to Jira to set a field
- Post-function, Configuration of the post-function
- Post-function: Name of the post-function
- Transition: Transition name and Workflow name on which the transition was added
- Configuration
See the examples below to understand how to filter and analyze the logs.
Download logs
Follow these steps to download your filtered logs :
- Go to the JMWE Logs page for the Jira Misc Workflow Extensions add-on.
- Filter logs using filters provided under
Log viewer. - Select a format from the
Formatdrop-down.
Format: The Format drop-down has options to select the format in which you want to download the logs. - Click on
Download logs.
Logs displayed in the table are downloaded. The download is limited to 200 events at most that match your filters selected.
Using logs for troubleshooting
If any of the JMWE post-functions you have used in your workflow does not seem to be working as you would expect, you can investigate the failure from these logs. For example:
1 - Creation of an Epic using Create issue post-function fails
Filtering your logs
- Go to JMWE Logs page
- Select
Create issuein Post-function - Click on
Apply filters
The table displays your filtered logs.
Analyzing the log
The first thing you need to do is look at Message, the last column of the table for the error/warning message (if any).
.png?version=1&modificationDate=1506069482164&cacheVersion=1&api=v2&width=1070&height=51)
Message: The post-function failed to create the Epic because the Epic Name was not provided which is mandatory while creating an Epic.
2 - Set of Component/s to "Backend,Testing" using Set field value post-function fails
Filtering your logs
- Go to JMWE Logs page
- Input the Issue key in
Issue keyfilter - Click on
Apply filters
The table displays your filtered logs.
Analyzing the log
The first thing you need to do is look at Message, the last column of the table for the error/warning message.
.png?version=1&modificationDate=1506080423438&cacheVersion=1&api=v2&width=1068&height=54)
Message: The post-function failed to set Component/s field with a component name "Testing". Clicking on > of the log entry and looking at Jira REST API call will display information on what value has been passed to Jira.
.png?version=1&modificationDate=1506080609380&cacheVersion=1&api=v2&width=900&height=228)
Jira REST API call: The Data shows that two components; Backend and Testing were passed to Jira instead of one i.e. "Backend,Testing". The comma(',') was considered as a delimiter in the array of values rather than a part of the component name. So you need to pass the value as JSON object ([{"name":"Backend,Testing"}]) selecting the "Treat value as JSON" option in the post-function configuration.
3 - Know impacted issues when using Set field value of linked issues post-function
While iterating over linked issues to set a field value using Set field value of linked issues post-function, there is no way of knowing which issues were impacted. You might then want to set the Temporary log level to DEBUG and trigger the transition that has the post-function.
Filtering your logs
- Go to JMWE Logs page
- Select
DEBUGin Level - Select
Set field value of linked issuesin Post-function - Click on
Apply filters
The table displays your filtered logs.
Analyzing the log
The table now has DEBUG entries indicating the setting of the field on the impacted linked issues.
.png?version=1&modificationDate=1506090430744&cacheVersion=1&api=v2&width=1069&height=56)
Using error and warning data posted to a webhook
When using a webhook, the raw content is sent as a JSON file.
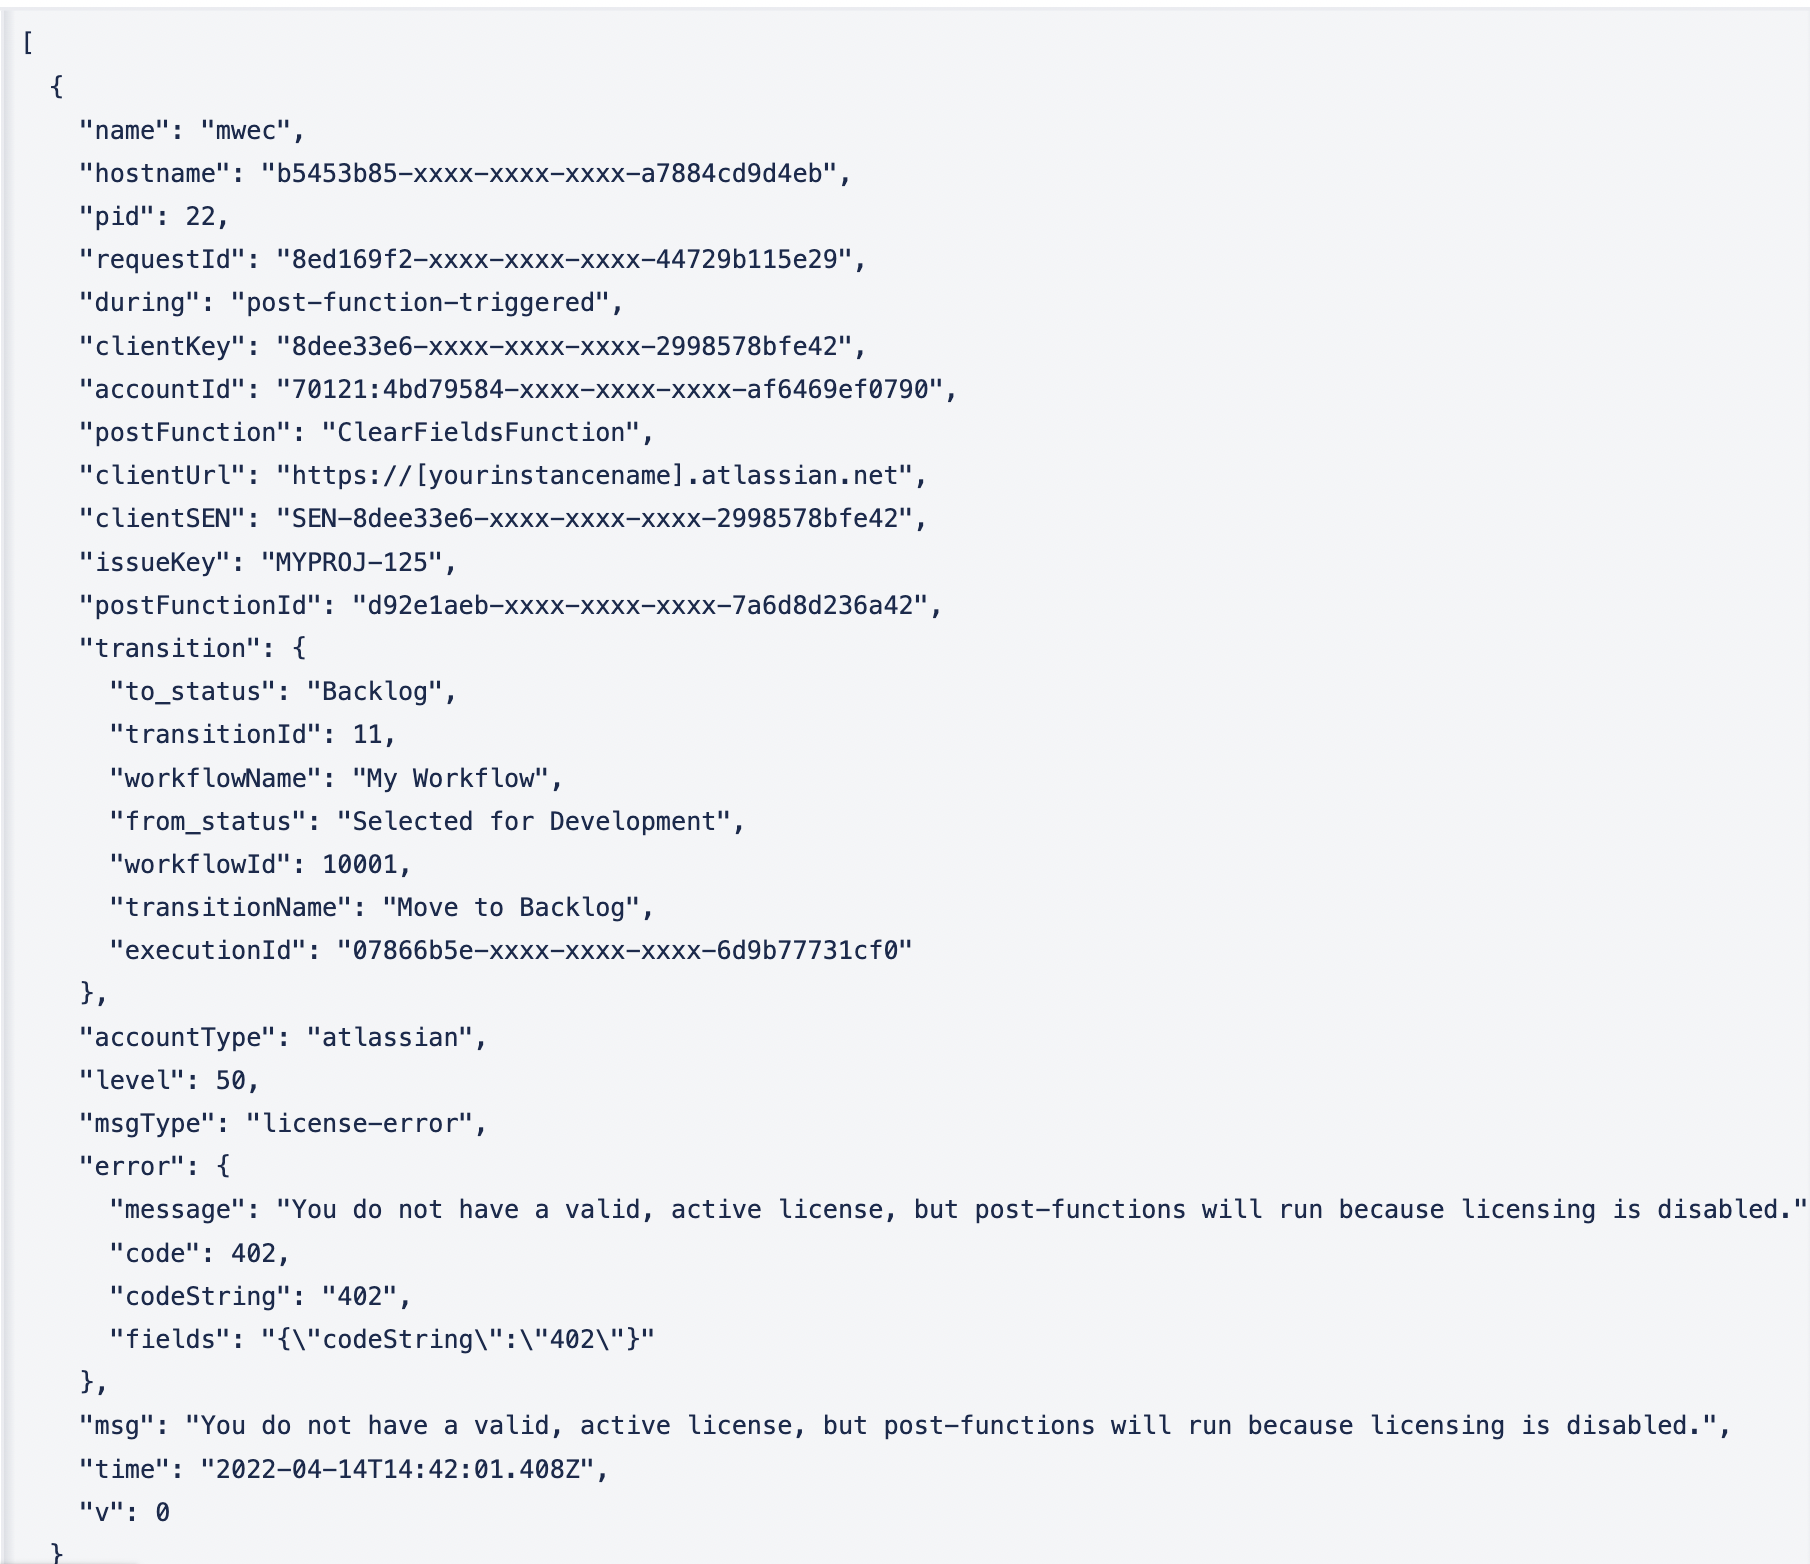
You can use this raw content to construct your own logging messages.
For example, you can derive:
A msgType occurred at time when during (post-function postFunction) on issueKey transition transition.transitionName (from status transition.from_status to status transition.to_status) of workflow transition.workflowName. The message is: error.message and the error code is error.code.
Using the sample data above, this reads:
A license-error occurred at 2022-04-14T14:42:01.408Z when post-function-triggered (post-function ClearFieldsFunction) on MYPROJ-125 transition Move to Backlog (from status Selected for Development to status Backlog) of workflow My Workflow. The message is: You do not have a valid, active license, but post-functions will run because licensing is disabled.and the error code is 402.